Key benefits for your firm
-
Data Visualization
Visualize your data the way you want to see it. -
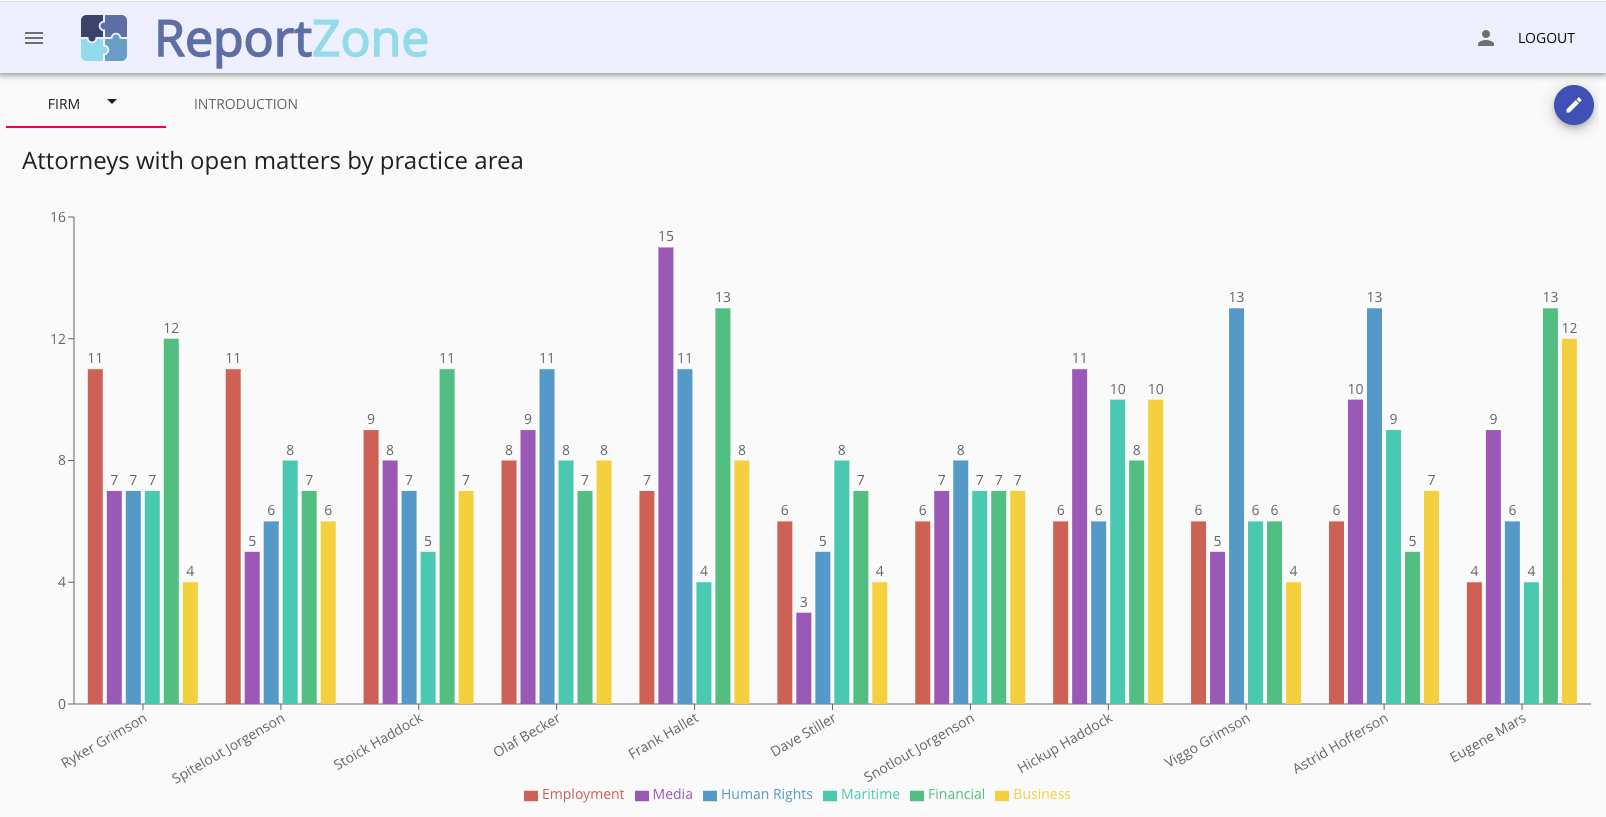
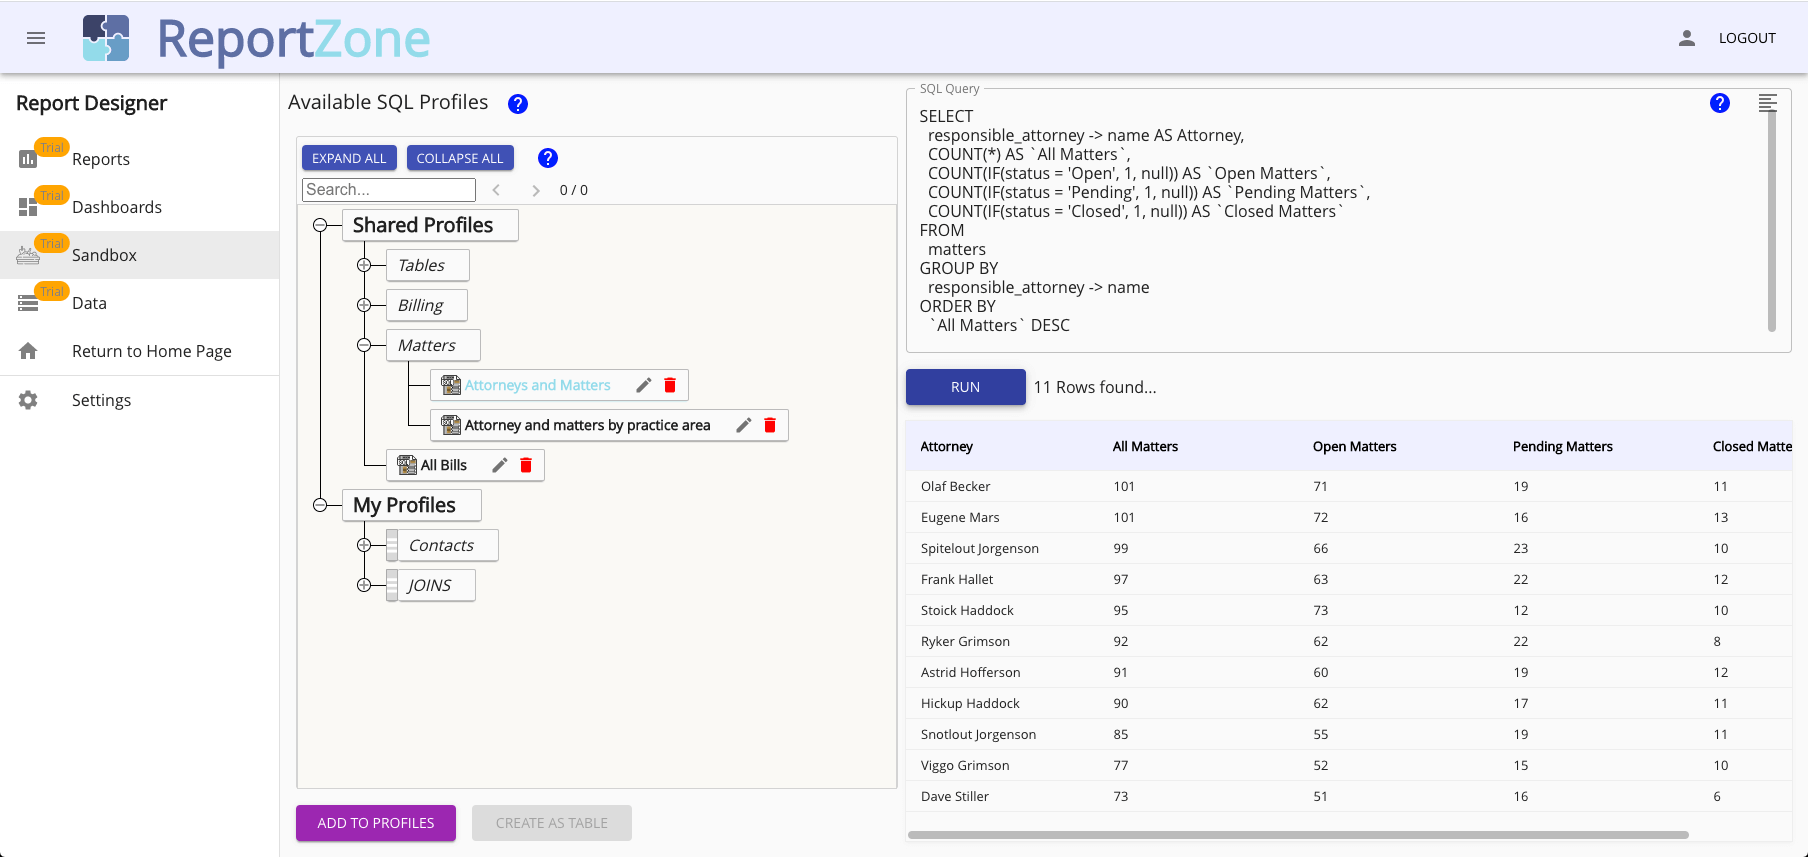
Create your Own Reports
Allows users to create completely custom Reports and organize them into any number of Dashboards. Create your own reports as Tables, Charts, Graphs from your Clio data. Don’t want to create or know how to create your own Reports? We provide many different Reports you can use or modify. -
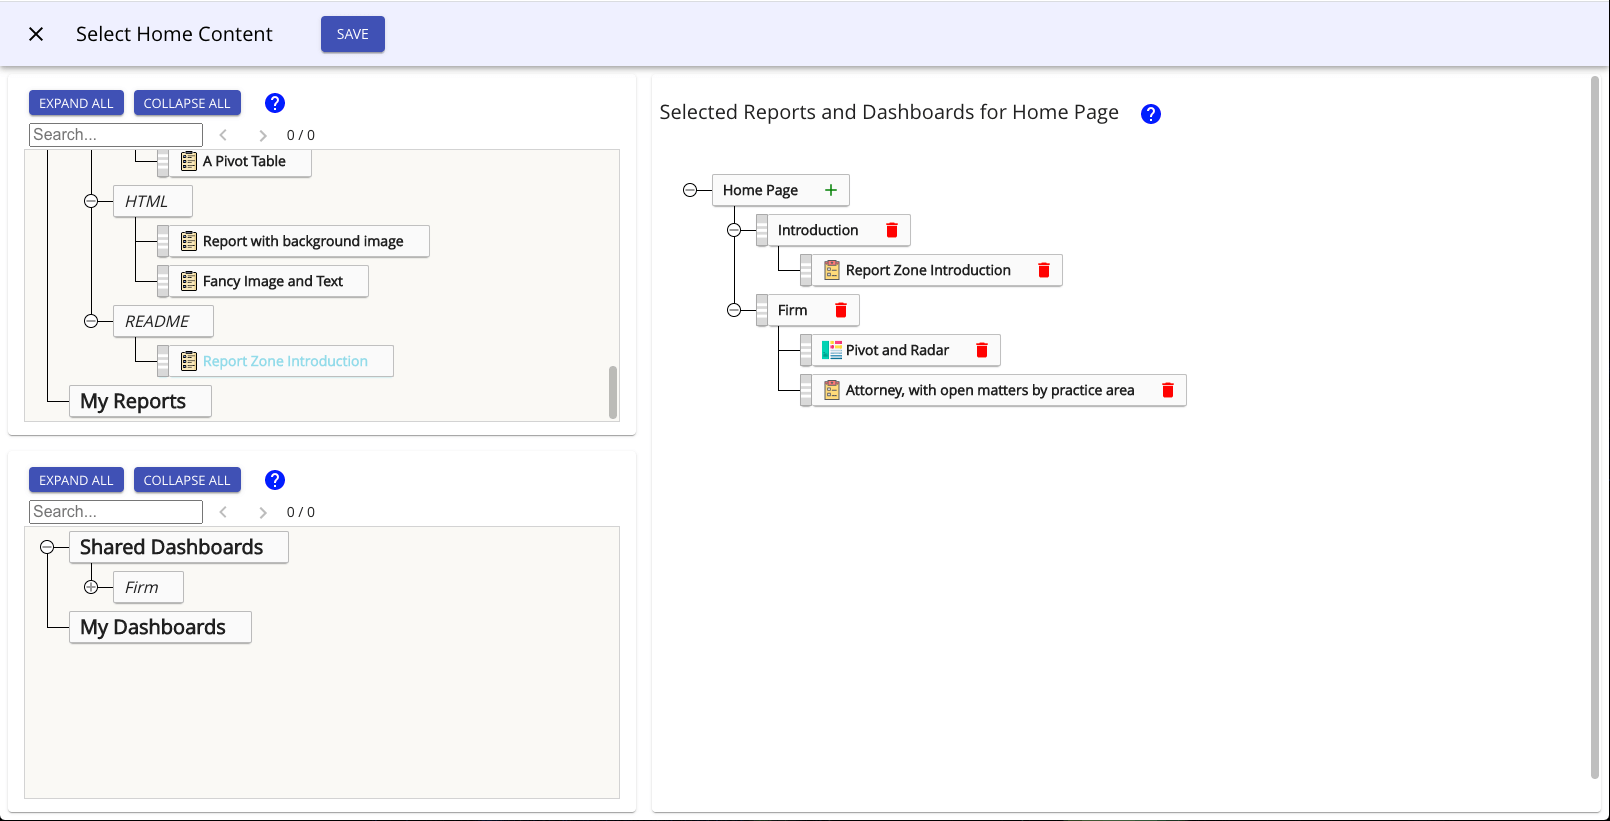
Organize Reports in your Dashboards
Pick your favourite Reports and organize them into any number of Dashboards e.g. for using custom categories like Firm, Attorneys, Financials, Billing, Matters or... Select your own private view of your Dashboards on your home page, completely customizable. Can’t figure out how to create a Report you need, fill out a request within the app. We will build it for FREE no extra charge!
How ReportZone works with Clio
-
There are several tutorial videos on the web site (see “Get Started”) and a ReportZone channel on YuoTube, and there is extensive help within the app.
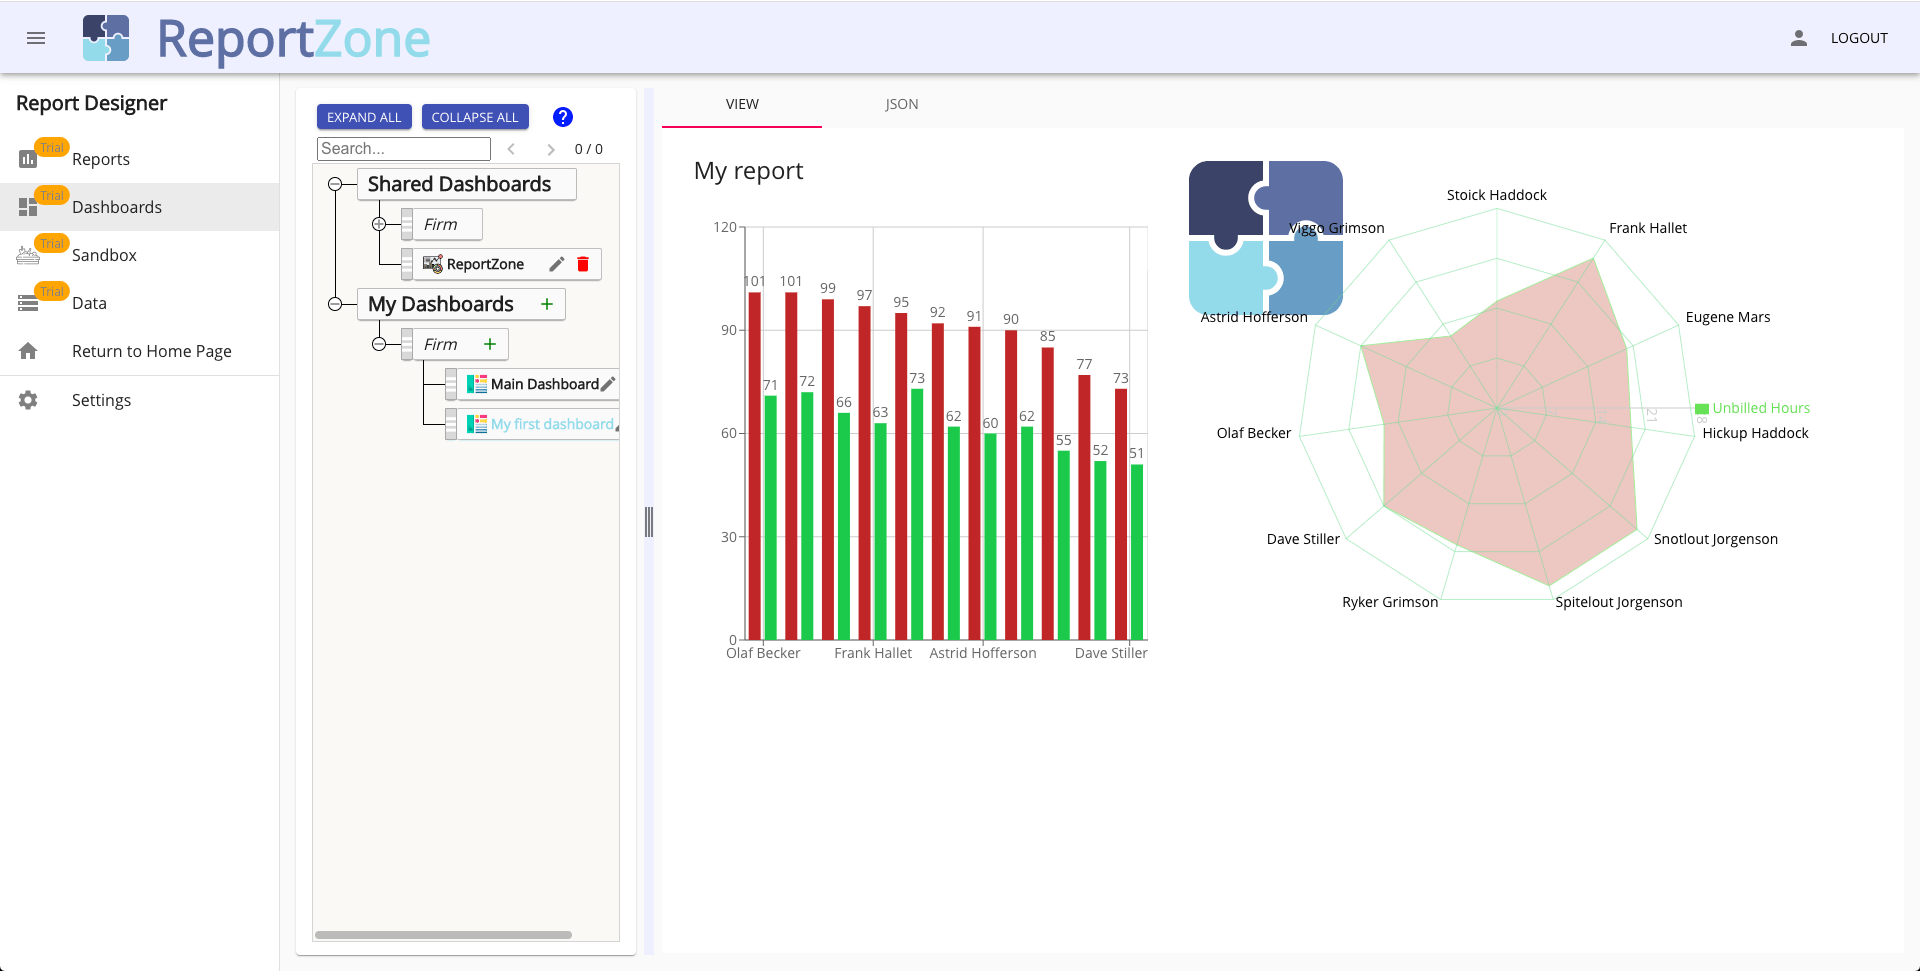
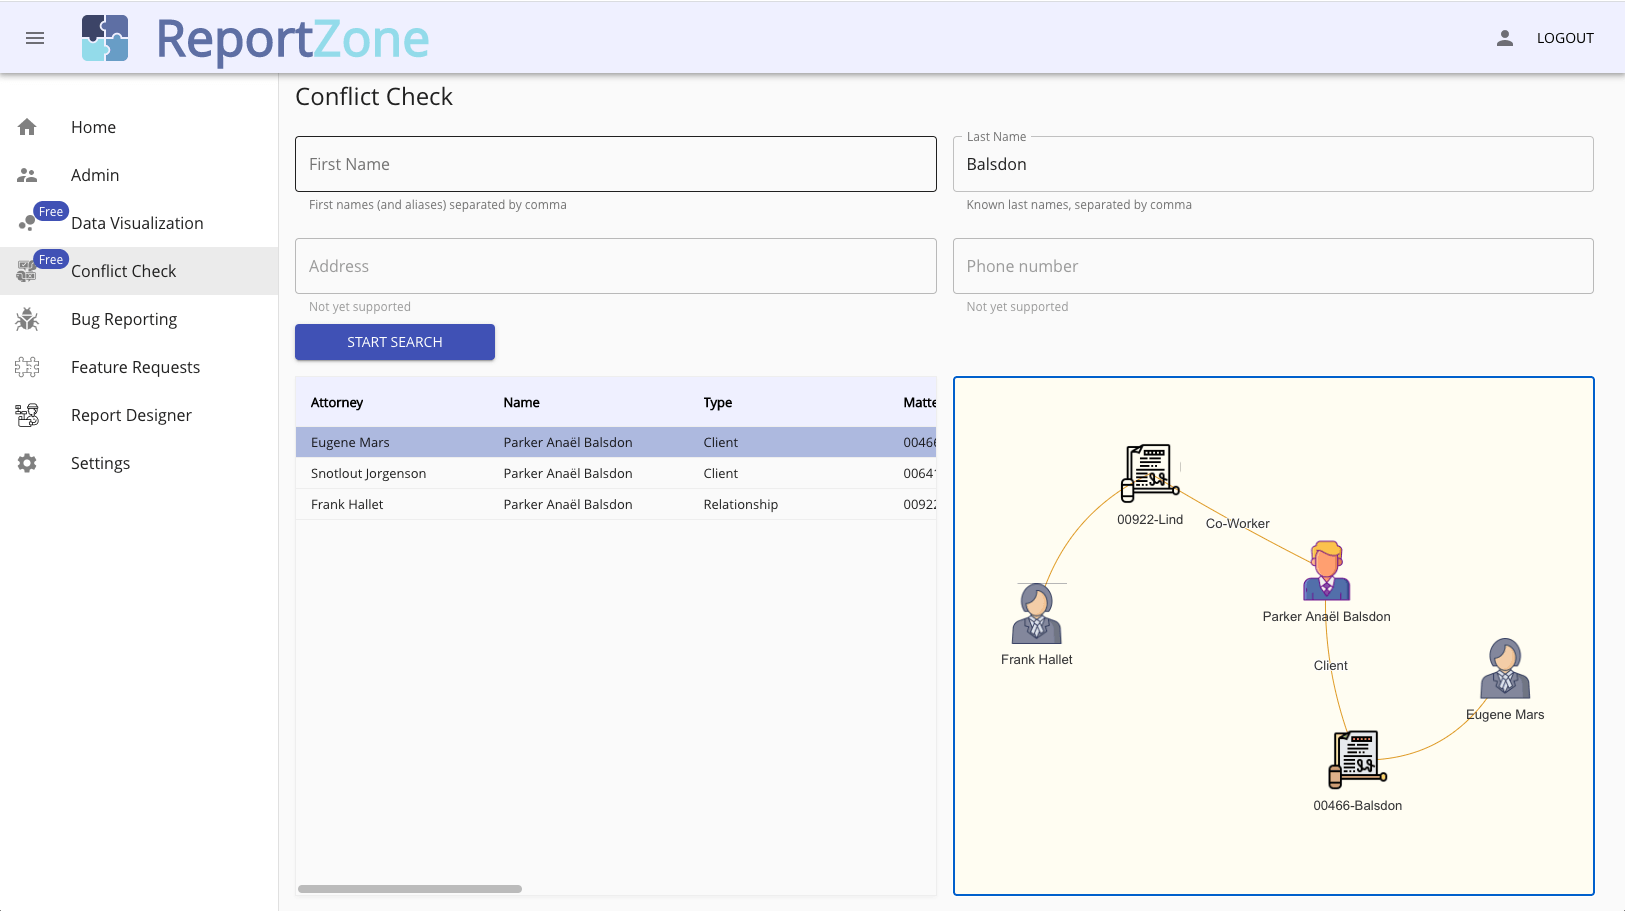
Home is where your main landing page resides, Designer lets you create your own Reports and Dashboards and Settings is where you find Account and Preference settings.
Ready to improve your workflow with ReportZone and Clio? Get Started
Media gallery